The new GraphQL API for Vector
Providing observability into your own apps and infrastructure, using the power of GraphQL and our new API.
Lee Benson
Published on 12/8/2020
Although Vector is an observability tool, it's nonetheless important to be able to observe Vector itself, especially in production environments where it serves as critical infrastructure. That's why we're excited to announce the new Vector GraphQL API, available in v0.11.0.
The API enables ad-hoc querying of:
- Your Vector topology, including
sources,transformsandsinks. - Uptime and health information.
- Event processing, byte processing, and error metrics, both per component and in aggregate across the Vector instance.
- Changes to your pipeline configuration, in real time.
This is just the beginning. In the near future, the API will enable you to both observe and control Vector remotely, programmatically, and on demand. Stay tuned!
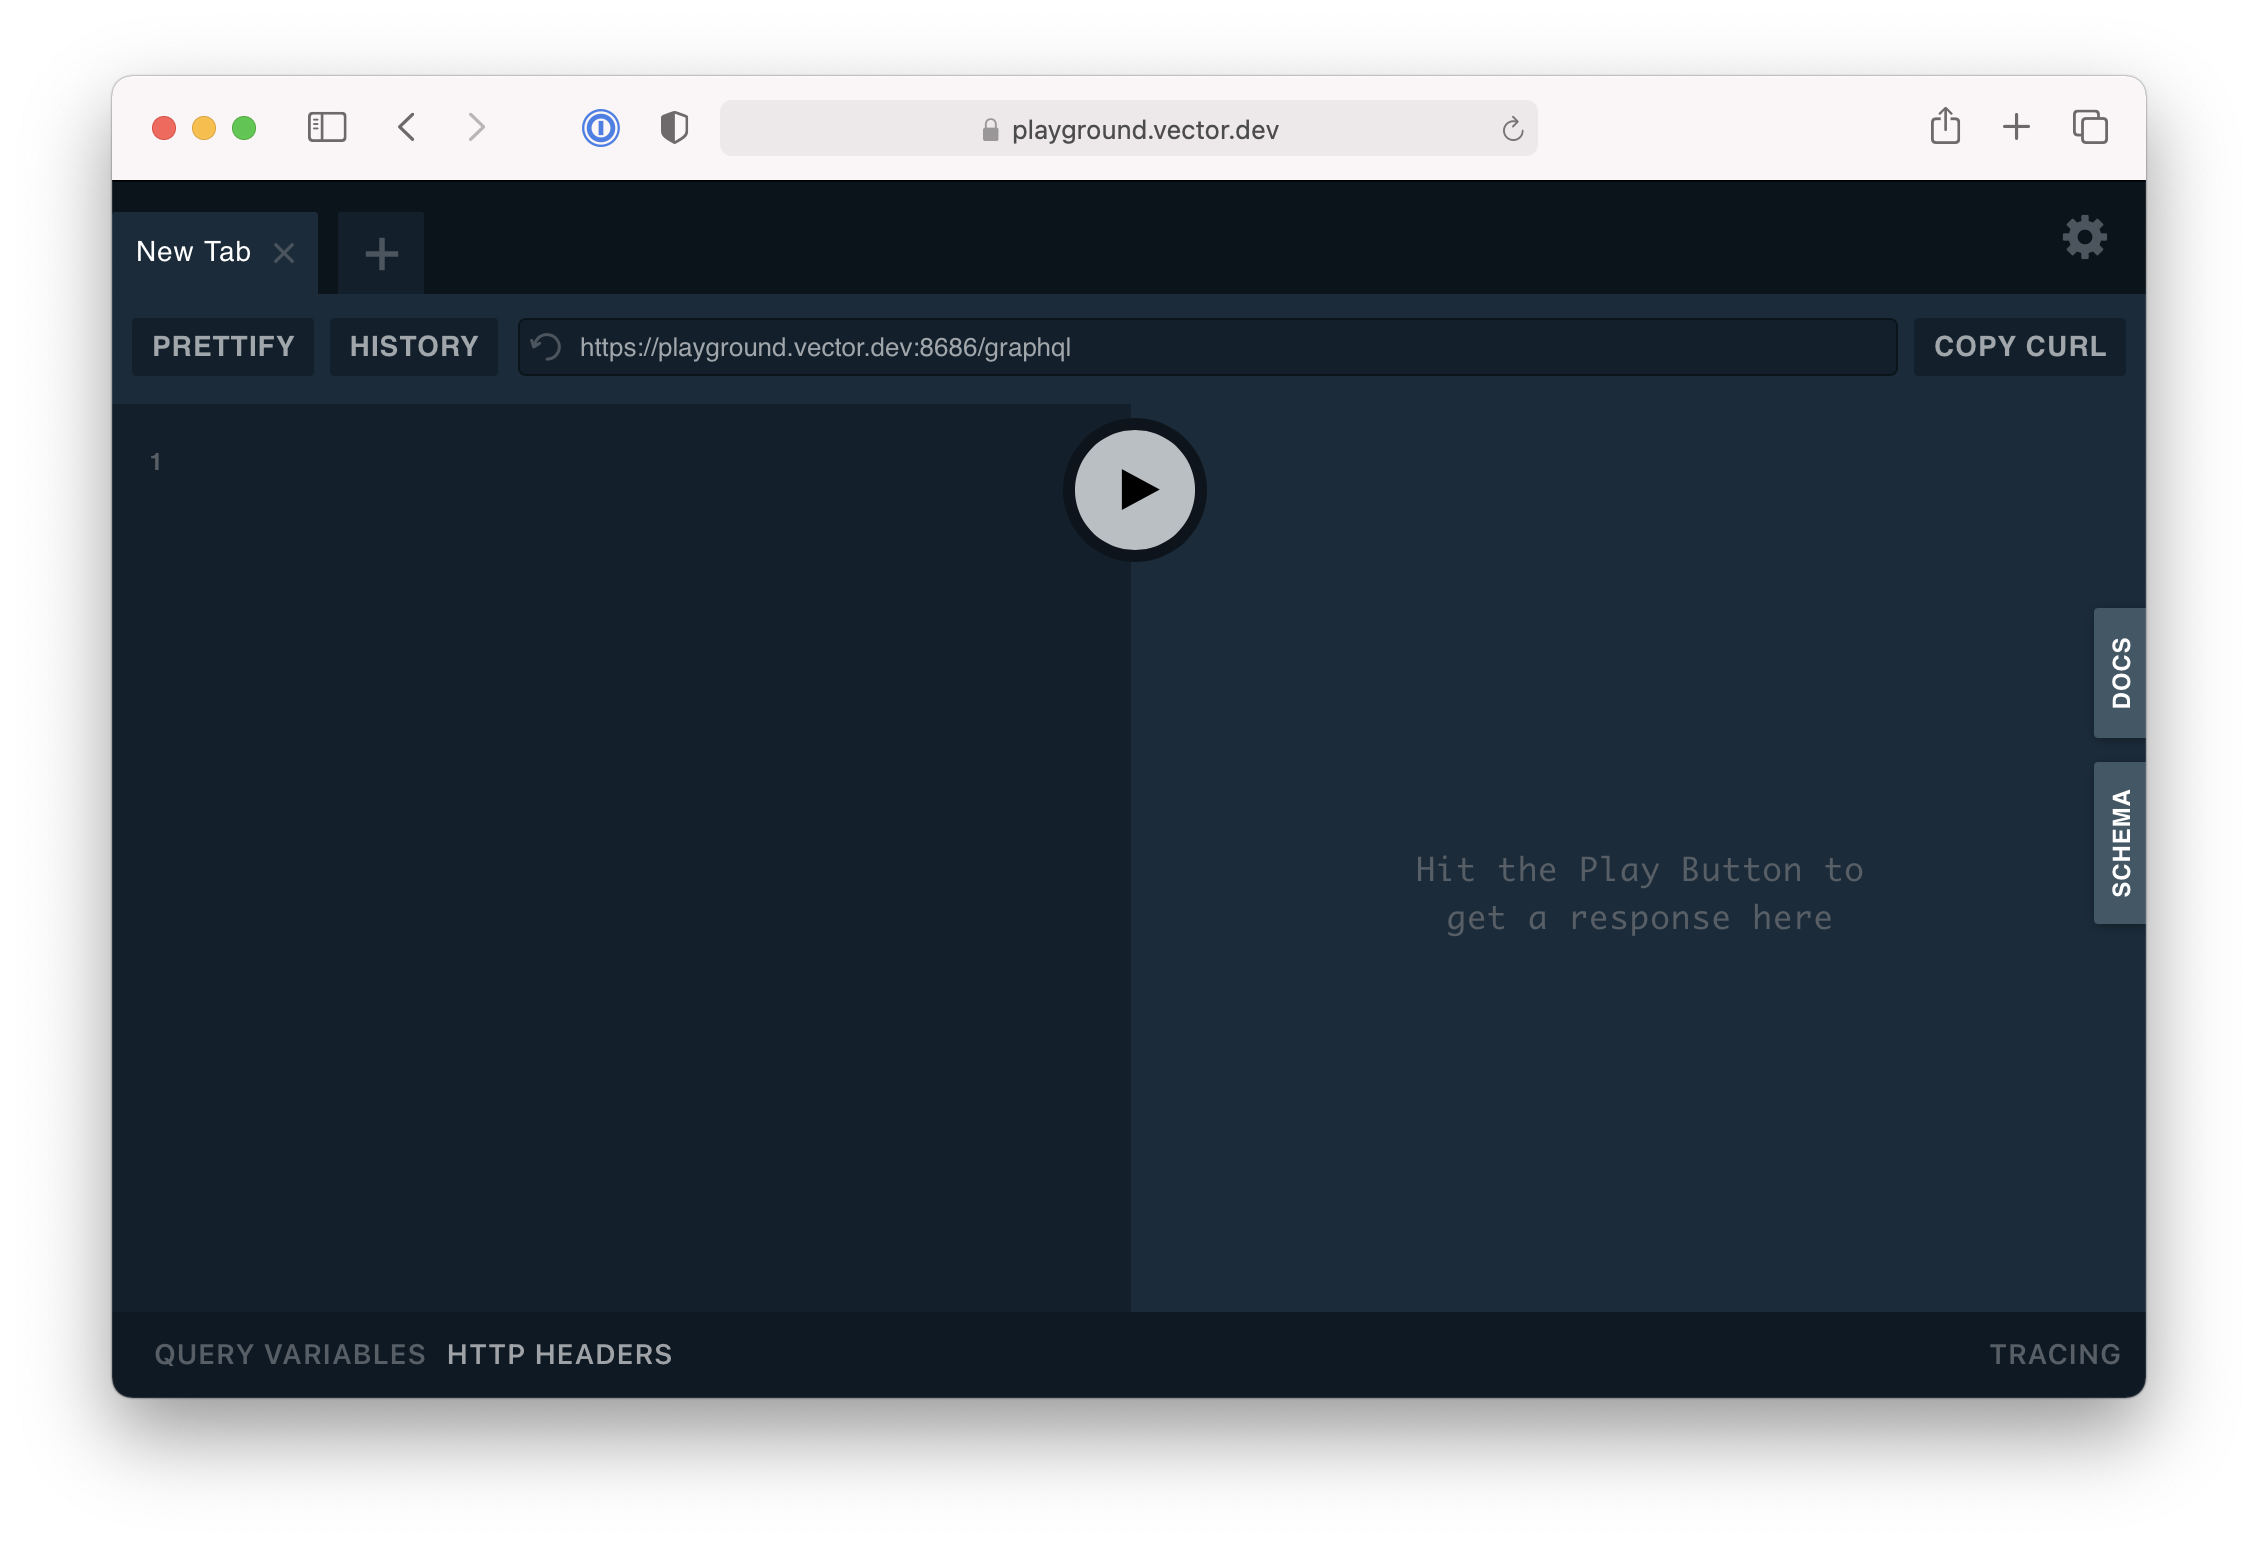
Take it for a spin in our live playground
Try our new GraphQL public playground today, which enables you to execute queries against a live Vector instance that we host and manage:
Here are a few queries you can try:
Health and uptime
See how long it's been since Vector last restarted, with streaming uptime that updates every second:
1subscription {
2  uptime {
3    seconds
4    timestamp
5  }
6}
Get configured topology + metrics
Get sources, transforms, and sinks configured by
vector.toml, along with total
events, bytes, and errors processed per component:
1query {
2  components {
3    __typename
4    componentId
5    processedEventsTotal {
6      processedEventsTotal
7    }
8    ... on Sink {
9      processedBytesTotal {
10        processedBytesTotal
11      }
12    }
13  }
14}
Hardware metrics
Get insight into the hardware Vector's running on, from memory and CPU usage to network activity and more.
1query {
2  hostMetrics {
3    memory {
4      totalBytes
5      freeBytes
6      usedBytes
7      activeBytes
8      availableBytes
9      inactiveBytes
10      buffersBytes
11      cachedBytes
12      sharedBytes
13      wiredBytes
14    }
15    network {
16      receiveBytesTotal
17      receiveErrsTotal
18      receivePacketsTotal
19      transmitBytesTotal
20      transmitErrsTotal
21      transmitPacketsDropTotal
22      transmitPacketsTotal
23    }
24    filesystem {
25      freeBytes
26      totalBytes
27      usedBytes
28    }
29    cpu {
30      cpuSecondsTotal
31    }
32    swap {
33      freeBytes
34      totalBytes
35      usedBytes
36      swappedInBytesTotal
37      swappedOutBytesTotal
38    }
39    loadAverage {
40      load1
41      load5
42      load15
43    }
44    disk {
45      readBytesTotal
46      readsCompletedTotal
47      writtenBytesTotal
48      writesCompletedTotal
49    }
50  }
51}
Enabling the Vector GraphQL API
The API is an opt-in feature that spawns an HTTP server to accept queries.
To enable, open your vector.toml, and add the following:
1[api]
2  enabled = true
3  address = "127.0.0.1:8686" # optional. Change IP/port if required
After restarting Vector, you can access an API playground at http://localhost:8686/playground.
Why we chose GraphQL
The Vector API uses GraphQL, a simple, type-safe, flexible query language.
We chose GraphQL over REST or gRPC for a few reasons:
- It's type safe. Clients can introspect schema and discern whether a query is valid before it's executed.
- Relational data (like Vector topology) is natural to model and query for.
- Data can be streamed via subscriptions over WebSockets, making it ideal for high-frequency metrics and a pub/sub pattern for observing topology changes.
- Data is returned in pure JSON, making it simple, readable, and easy to parse.
- There's great language/library tooling, making it trivial to interop with existing applications.
- Compile-time type safety in Rust, via async-graphql (server) and graphql-client.
- Universal browser support, making it an ideal protocol for web usage (or apps!).
Our first API clien: toptop
To help you visualize your Vector instance in action,
v0.11.0 also brings you vector top, our
new terminal dashboard CLI tool powered by the Vector GraphQL API.
To enable it, run:
1vector top # pass --url <http://path/to/graphql> for remote observability
On Linux, Windows and macOS, you'll get an interface like this:
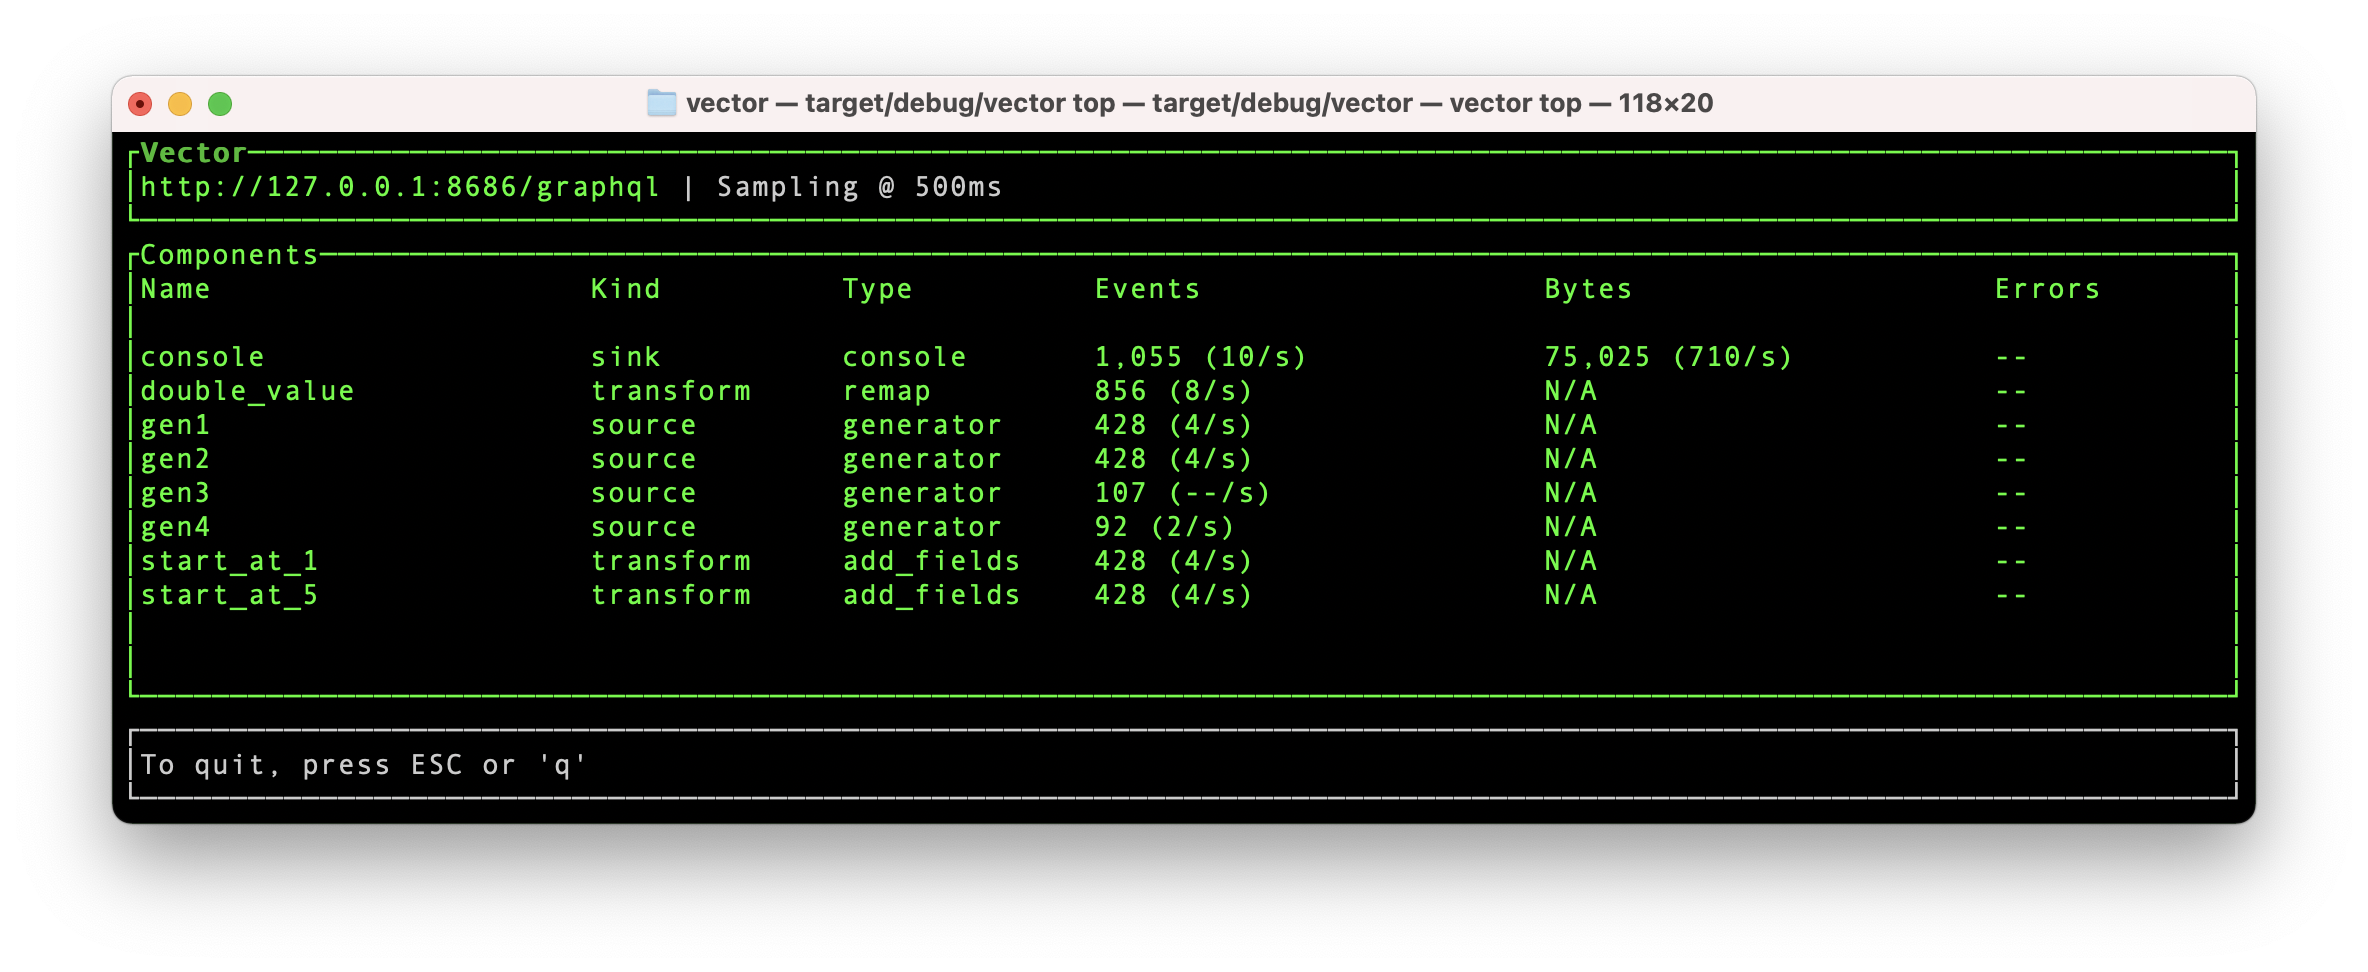
This will display your configured components and metrics, updating
every second (pass a millisecond --interval to adjust). If you run Vector in
watch mode, it'll
even pick up topology changes automatically.
I'll be telling you more about vector top soon in a dedicated blog post.
What's next?
This release introduces the API and a sample client, but we're just getting started. In future releases, we'll be expanding the API's capabilities to include:
-
Validating and changing configuration programmatically. So far, all of our queries have been read-only. Future versions will include GraphQL mutations that allow changes to a running Vector pipeline (think: HTTP POST-style requests).
-
An exciting new web UI for visualising and interacting with topology.
-
Component-specific types and metrics that can provide much deeper and more granular insight into what's happening in your topology
Follow us at @vectordotdev to be notified of updates.
Further reading
GraphQL is an API protocol introduced by Facebook. You can learn more at https://graphql.org
For clients and language support, check out Awesome GraphQL, a curated list of libraries and other helpers.
For a deeper dive into the currently supported fields in the Vector API, your best source of information is the "Docs" sidebar in the API playground. As a type-safe interface, GraphQL is self-documenting. Review the inline comments to learn more about what a field returns. We'll eventually add to this with dedicated API docs, but this is a great way to get started.
In future posts we'll be exploring the GraphQL ecosystem in more detail and explaining the mechanics of what made GraphQL a winning choice for the Vector API, over some of the alternatives such as REST or gRPC ‐ including a deep dive into Rust libs and code snippets.
Stay tuned!